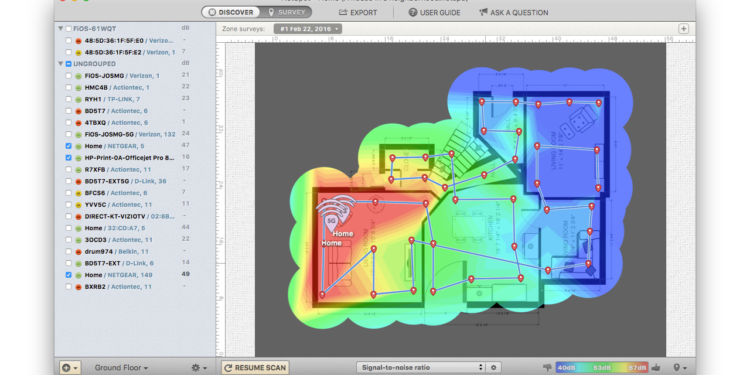
WiFi heat maps are a type of visualization that shows the level of wireless internet activity in a given location. The “heat” can be seen on a map, which illustrates the influence of the wireless signal in a dedicated space. These visuals offer a unique perspective on where WiFi is available and can be a valuable resource for many different uses. This article will go into detail about what a WiFi heat map is, and what tools can help you create a map to check WiFi coverage and detect potential problems in your wireless network.
What Information Does a WiFi Heat Map Provide?
A WiFi heat map is a representation of the coverage and intensity of a wireless network’s signal. By overlaying the heat map on top of a floor plan image, network owners can check WiFi coverage and get a clear understanding of where issue areas are situated in relation to the gathered survey data and the positions of access points. A wireless site survey is the best method to gather this data. A WiFi site survey is used to assess the feasibility of installing a wireless network and locate the optimum locations for access points, cables, and antennas.
With site surveys and heat maps, information about areas with signal deficiency and interference in a network becomes visible, allowing those issues to be targeted and fixed. Site surveys also help network security professionals find and remove rogue access points, identify unauthorized workstations, and prevent cross-channel interference.
Software For Creating a WiFi Heat Map
Dealing with networks can be a tricky task. If you want to check your WiFi coverage, the coverage mapping procedure is easier with the help of WiFi heat map software. This type of software allows you to simply upload a room design map or blueprint and walkabout with a device connected to the software to gather data. The software will automatically create a WiFi heat map using the gathered data.
There are several options out there to create a heat map and check WiFi coverage. NetSpot, however, is the only software available that is designed to meet the needs of both professionals and household users.
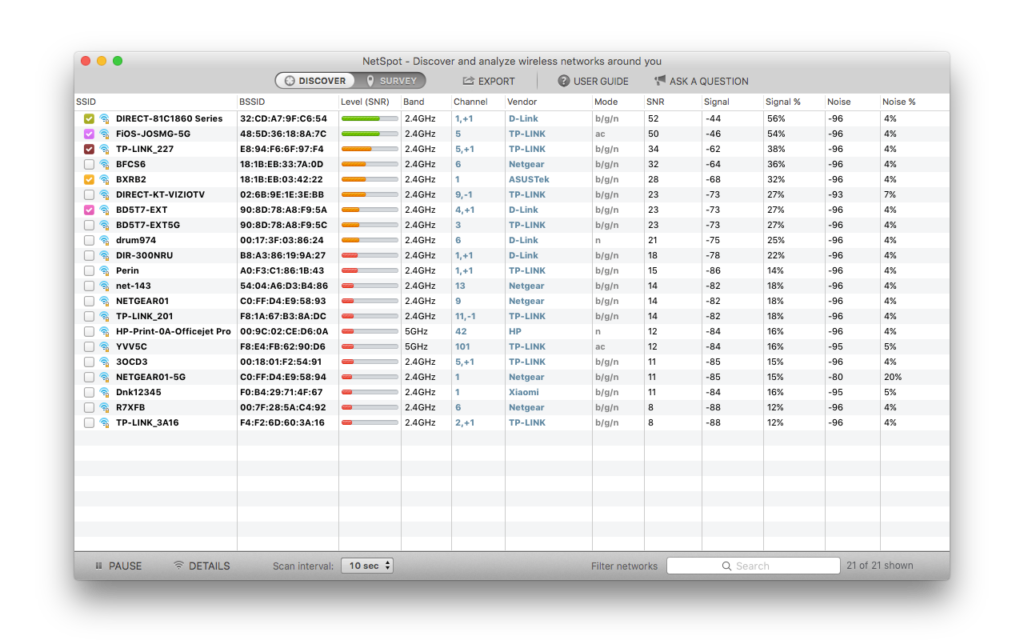
You can conduct a site survey with NetSpot by walking, marking your location on the map, and allowing NetSpot a few seconds to gather data samples. NetSpot makes its software useful for everyone, from the average household administrator to professional network administrators, by assisting in the analysis of every access point. With NetSpot, you can create a WiFi heat map to check your WiFi coverage and the strength of your wireless connection in different locations of your house, office, or workplace. In addition, NetSpot provides reports, infographics, and simple explanations to help any user comprehend the findings of their site survey. With this information, you can easily troubleshoot network issues and set up a wireless network without any guesswork.
Create a WiFi Heat Map with NetSpot
With NetSpot, it’s simple to conduct a site survey and check WiFi coverage. All you need is a computer with NetSpot installed and connected to your wireless network. Here is the step-by-step process to create a WiFi heap map and check WiFi coverage:
- Open NetSpot, change the toggle at the top of the screen from DISCOVER to
- Select Start a New Survey.
- Name your project and first scanning zone. Additionally, users have the option to change the zone environment type.
- Choose a map option such as load a map from your computer or create your own map, then click Continue in the bottom right.
- Input the actual distance between two locations on the map in the box at the bottom of the window. Choose the correct unit of measurement (feet or meters). Then click Continue.
- On the next two screens, PRO users can add hidden networks and run an active scan. Non-PRO users can click Continue to proceed.
- Move to a corner of your space and click the map’s corresponding point. Once the program has started measuring, it may take 10 seconds to several minutes. Keep still throughout this time. The green circle will appear when finished.
- Continue scanning until the whole map or zones you want are scanned. Your dimensions should be close enough that the green circles overlap. By the end of your survey, most of your survey area should be green.
- When finished, click the Stop Scan button in the bottom left of the NetSpot window to see the heat maps and visualizations.
Using Visualizations to Understand WiFi Coverage
NetSpot provides more than fifteen heat map visualizations to assist with troubleshooting and management of any WiFi network. In addition, NetSpot provides a range of where your network should fall for each of these visualizations so you can better understand your wireless network and troubleshoot potential problems.
Here are the details of each type of visualization:
Signal-to-noise ratio: Compares the strength of the WiFi signal to the background noise. Noise sources include microwave ovens, cordless phones, and Bluetooth gadgets.
Signal level: Indicates the signal strength of your WiFi. The Signal visualization helps you comprehend your Signal-to-Noise Ratio (SNR). Separating the signal from the noise can help uncover underlying issues producing low SNR.
Signal-to-interference ratio: Comparable to the SNR, but the SIR is unique to co-channel interference from other radio transmitters.
Noise level: On-site interference is measured by the noise level. Noise degrades WiFi signal. The list of noise sources includes wireless game controllers, fluorescent lights, Bluetooth devices, and more.
Quantity of access points: Indicates your wireless network’s current access points and their signals.
Frequency band coverage: Measures how the 2.4GHz and 5GHz frequency bands are distributed in your environment and where the signal may be missing entirely.
PHY mode coverage: Measures the 802.11 WiFi protocols (a/b/g/n or ac) modes utilized in your wireless area.
Download speed: Indicates how quickly data can be downloaded from the Internet to your PC on your network.
Upload speed: Indicates how quickly data can be uploaded to the Internet from your PC on your network.
Wireless transmit rate: Depicts the rate at which data is transferred from an access point to a network-connected wireless device.
Iperf3 upload: Measures and then visualizes upload speed through HTTP, TCP, or UDP protocols.
Iperf3 download: Measures and then visualizes download speed through HTTP, TCP, or UDP protocols.
NetSpot: The Best Software for WiFi Heat Map Creation
Without WiFi heat maps, checking and troubleshooting your wireless network becomes a guessing game. NetSpot takes the guesswork out by making it simple to conduct site surveys in a matter of minutes and to view information about your wireless networks with convenient visualizations. If you are interested in learning more about your wireless network, whether you want to troubleshoot, check WiFi coverage, or have added security, NetSpot is the best option to create a WiFi heat map and get in-depth knowledge about your network.


